It seems impossible that the MIT Sloan Sports Analytics Conference was last month.
So much has happened since. Four days after the conference’s conclusion, the coronavirus outbreak was declared a global pandemic. Reports of Tom Hanks and Rudy Gobert testing positive for coronavirus came the following day. One after another, events like March Madness, The Masters, MLB’s Opening Day and the NBA regular season were postponed or cancelled.
The days and weeks following this year’s SSAC were certainly much different than those following the first one I attended as a wide-eyed college student six years ago. But the conference itself provided plenty of elements of comforting familiarity. Bill James and Nate Silver were among the panelists dishing out knowledge and opinions. Coaches and executives offered their perspectives on how analytics impacts their day-to-day routines and operations. Professionals within the sports analytics industry showcased their impressive work over the past year.
When I came to SSAC in 2014, MLB introduced the groundbreaking Statcast technology to the world. Six years later, as evidenced by many impressive workshops and presentations at last month’s SSAC20, baseball is far from the only sport reaping the benefits of player tracking technology.
Returning to the conference this year and geeking out for a couple days was an incredible experience. Attending as someone who has spent the better part of the last five years as a NYC-based Tableau consultant gave me a chance to see things at SSAC20 through a unique lens. There were endless opportunities for insights and takeaways at this year’s conference, both in the large panels held in the biggest ballrooms available and in the more intimate presentations held in the smaller breakout rooms.
Here are five lessons I learned from this year’s MIT SSAC20.
Lesson #1: Remember Who’s in the Batters’ Box
Ichiro Suzuki was as prolific and entertaining a leadoff man as any in the history of baseball.
He arrived in the United States after playing in Japan for nine years and wasted no time making his mark on the game in America. Ichiro captured MVP and Rookie of the Year honors in 2001. Three years later, Suzuki set the single-season hits record (262). He was an All-Star and Gold Glove winner in each of his first 10 MLB seasons, all with the Mariners. He had the second-best batting average (.331), third-most stolen bases (383) and fourth-best Wins Above Replacement (53.3) among all qualified position players in those first 10 years as a big-leaguer.
Suzuki was a mainstay at the top of the Seattle lineup, logging nearly 99% of his plate appearances in the leadoff spot during that decade-long stretch. His 2,529 career hits from the leadoff spot are currently the third-most all-time, behind only Rickey Henderson (3,020) and Pete Rose (2,924) – neither of whom came close to Suzuki’s .321 batting average from the top of the order.
Yet, despite all that success with Ichiro penciled in at the #1 spot of the Seattle lineup card, Tom Tango thought it best to move him to the #2 spot. Tango, who was a consultant with the Mariners at the end of the decade, saw an opportunity to optimize the Mariners lineup by moving Ichiro down a spot. It hadn’t been long since Tango literally helped write the book on lineup optimization, among many other analytics-driven topics in a publication aptly named “The Book: Playing the Percentages in Baseball”.
“It was so much more natural for him,” Tango said.
Tango was convinced moving Suzuki down to the second spot in the lineup, while it meant fewer plate appearances for him, would result in the Mariners scoring more runs. Suzuki would have more opportunities to drive in runs and even if he didn’t come to the plate as often, theoretically, those trips to the plate would become more impactful. Ichiro, however, would not budge from his cherished spot at the top of the order.
“We couldn’t figure out why,” said Tango, currently MLB’s in-house senior database architect. “[Then] we learned that in Japan being a leadoff hitter is a high honor. It’s like being a cleanup hitter here [in the US]. So, to Ichiro, batting second, which would be really good, is actually to his view, like a demotion.”
Tango was asked at the MIT Sloan Sports Analytics Conference earlier this month which topics he thought organizations should change their approach in. He said it was the focus on the batting order and used his experience with Ichiro to illustrate why.
“There’s a lot of theories about it,” said Tango, who was joined on this panel, “Moneyball to Homerball”, by Bill James. “You have to be aware, as much as you want to help the club, you have to know the players as well.”

Tom Tango and Bill James share their perspectives on the latest developments within the sports analytics industry.
Often times as a Tableau consultant, there are solutions that come to mind that seem like no-brainers. Yet, as foolproof and airtight as they might be on the surface, there are other considerations to keep in mind. Who are the ones, at the end of the day, that will be using this dashboard every day? What kinds of visualizations have they been conditioned to consume?
Supporting decision-makers as they dig into the batters’ box means bringing not just Tableau expertise to the table, but developing an understanding of what makes them comfortable as one attempts to develop solutions that keep them informed. And it means not only taking the time to develop those solutions but making sure that those decision-makers are also convinced it will provide the desired insights and value.
Lesson #2: Buy-in Takes Time
On this same panel, Bill James, the godfather of the modern baseball analytics movement, was asked what it takes to get buy-in from teams when presenting data-driven solutions. Simply, James answered: “What it takes is time.”
Tango used an idea that is gaining popularity in baseball to drive home this point – the “opener”. The theory is that innings are better allocated across pitchers if they aren’t divided into the traditional groups of starters and relievers. Instead of having a starter aim to throw 5-7 innings, followed by a handful of relievers finishing the game, nobody should pitch more than a few innings in any game. This way, nobody has to face anyone in the opposing lineup more than twice as it’s well-established that starting pitchers, on average, get worse each time through the order. The first pitcher a team sends to the mound in a game wouldn’t be called the “starter”. They’d be referred to as the “opener”.
In practice, though, this can be a tough sell to pitchers. Many are creature of strict habit, particularly the starters. Pitching 200 innings in a season, while a more rare feat now than decades ago, remains a point of pride for many. There are also financial implications. Establishing yourself as a consistent, reliable, innings-eating starting pitcher can mean bigger contracts.
Relievers, by definition, are not normally used to throwing their team’s first pitch in a game. Some may have began their careers as starters at some level, but once they have created a routine geared towards getting ready to come out of the bullpen with a game already in progress, it can be a tough habit to break.
“It’s probably more a question of how to manage personalities,” Tango said. “You might gain a few runs to maybe a win. But if the relievers don’t buy in, their performance is going to suffer. If you don’t have buy-in, you can take one step forward [based on] theory, but 10 steps back on implementation. It doesn’t really help anyone if no one buys in.”
When I first attended the Sloan Sports Analytics Conference six years ago, a Duke student presented a paper making a case for using openers. I talked to him after the presentation and he told me he wasn’t able to get the Blue Devils baseball program to adopt the strategy. But it’s recently gained traction in the big leagues. After the Tampa Bay Rays first tried it out in 2018, they were joined by a dozen other teams who used an opener in at least one game last season. It will be interesting to revisit what the adoption of this strategy looks like in another six years.
Lesson #3: Knowing the Answer Doesn’t Mean You Know Everything
When it comes to visualizations we build for our clients, they’re of course there to answer relevant business questions. Sometimes those answers are obvious before anything is built in Tableau. However, it’s the dashboards developed there that often reveal just how true (or untrue) something is – and this is where those dashboards can provide real value.
More than a decade ago, Tango found himself in a similar situation when digging into the impact of how well catchers framed pitches. How often could a skilled catcher turn a ball into a strike? There was no denying that framing pitches well was worth something – but how much could it be worth? The topic has gone through many rounds of analysis and examination over the years, but it turns out having an elite pitch framer can be worth as much as an extra win or two in any given year – nothing to write off for a team in the midst of a playoff race at the end of the season.
“Everyone kind of already knew that it was kind of important, but they didn’t realize how important,” said Tango. “That’s what our job is. We kind of know what the answer is, but we don’t know what the magnitude of it is. We shine a light on it. The catcher framing now is so commonplace that everybody just takes it for granted. But 15 years ago, nobody talked about it."
Lesson #4: Simplicity is Key
Easily one of the most entertaining panels of the conference was, unsurprisingly, the one Mississippi State head coach Mike Leach served on – “Moving the Chains: Advancing Football Analytics.” ESPN’s Mina Kimes moderated the panel, which also included Philadelphia Eagles VP of Operations Alec Halaby and ESPN Senior Analytics Specialist Brian Burke.
Leach’s ability to steer a conversation towards off-the-wall topics is well-documented. This panel was no different. But the quarterback guru who has guided Texas Tech and Washington State to arguably the greatest heights in their respective program histories also offered a glimpse into how he incorporates analytics into his coaching philosophy and how he guards against getting lost in the weeds.
“These guys are quantifying everything,” said Leach, who is entering his first season with the Bulldogs. “What becomes the temptation is to try to tell your players all the stuff they know. You can’t. ‘Oh, there’s a 20% chance they’re gonna do this. There’s a 50% chance they’re gonna do that. And, don’t forget, there’s a 5% chance they might do that.’”
“Nobody can go there and trigger with a rocket up their ass and blow up the ball carrier if you’re sitting there thinking about 5%. I think there’s knowledge and then there’s applicable knowledge. Your players need applicable knowledge.”
Leave it to Leach to make such a great point in such a colorful way. But the reminder that one should avoid pushing too much information to someone is a valuable one. With so much data at our fingertips, there are fewer and fewer questions that we can’t answer anymore. But that doesn’t necessarily we should try to answer all of them at the same time. People, to varying degrees, can only process so much information at once.
From a Tableau perspective, simplicity is key. Showing too much information, however insightful it might all be, can take away from its potential value if it looks like a jumbled mess to a user. Seeing too many charts all at once can take away from the insights they might be able to provide on their own or if they were shown in a more visually manageable manner. Presenting those insights in a clear, concise and simple way can be just as important as uncovering those insights in the first place.
“It is the nature of analysis to drill down to smaller and smaller questions,” Bill James advised during the “Moneyball to Homerball” panel. “Learn to focus on the bigger questions.”
Lesson #5: Data Visualization is All Over the Sports Industry
It was incredibly exciting to see how so many different people across the sports industry were utilizing data visualizations in their day-to-day work life. Many are using Tableau, including the NFL, who has built reports in the tool analyzing their vast amounts of ticketing data.
NFL Director of Strategy and Analytics Kristen Mackie presented some of the dashboards her team is using to visualize that data in the session titled “Open for Business: How an Open Distribution Ticketing Network is Changing the Way the NFL Operates”. During that same session, Baltimore Ravens director of business intelligence Cody Williams showed attendees how they were able to visualize their ticketing accomplishments and initiatives in the midst of a wildly successful 14-2 season.


A look into how the NFL is tracking market KPIs during the season
Analysts from FC Barcelona and Texas A&M football presented some of their work surrounding how they’re leveraging player tracking data to give their respective teams a competitive edge. One particularly fascinating visualization was the one FC Barcelona’s Javier Fernandez showed attendees that involved overlaying game film with suggested passing options each time the ball arrived at a different player’s feet.
Other interesting visualizations included those shown by Matt Courchene (DataGolf), Kirk Goldsberry (ESPN) and Paul Sabin (ESPN).
Courchene’s win probability graphs and player performance trend charts told compelling stories about individuals and the tournaments they play in. During his presentation – “Who Will Win? Predicting, Visualizing and Understanding Performance in Professional Golf” – Courchene, co-founder of DataGolf, walked attendees through the math behind those visualizations and the stories they tell.


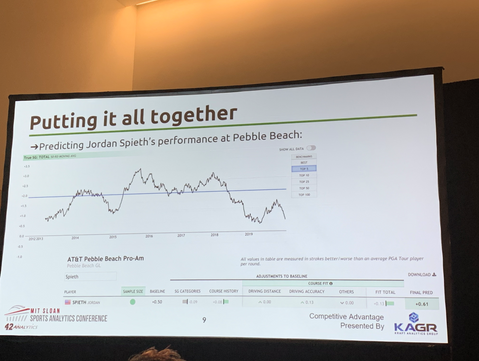
What the numbers say about Jordan Spieth’s and Tiger Woods’ careers
Goldsberry, a New York Times best-selling author and current UT-Austin professor, was on the panel titled “3s & Frees: The Evolving Nature of Basketball”. He has been well-known for his incredible shot chart visualizations for a while now, and recently showcased them in his new book “SprawlBall: A Visual Tour of the New Era of the NBA”. Seeing his chart comparing the 200 most common shot locations from decades ago compared to now showed just how stark the shift in style has been.

Another of Kirk Goldsberry’s signature short chart visualizations, showing how the game of basketball has evolved over the past couple decades
Sabin presented his findings on which positions were the most valuable in college football during a session called “Playing Catchup: Estimating Player & Positional Value in (American) Football”. Not surprisingly, quarterback finished at the top of the list but it was a bit of a shock to see center second on the list. The visualization he showed that revealed the variance in performance and value across players in each position group was extremely insightful.
Emptying the Notebook
· If there was a panel more entertaining the one Mike Leach one, it might have been “Sports in 2040: Hindsight in 2020”. Moderated by ESPN’s Katie Nolan, the panel included Bill James, Nate Silver, Daryl Morey and Jessica Gelman. Among the topics discussed were the viability of football as a sport and uploading people’s consciousness to robots that played in the actual games. Silver set the over/under for the NBA adopting the Elam Ending that got such positive reviews at this year’s All-Star Game at 2031. James delivered possibly the best zinger when talking about baseball’s current pace of play issues: “The game has changed a lot in the last 20 years. For example, if you remember, the game used to be fun to watch.”

Daryl Morey, Jessica Gelman, Bill James, Nate Silver and Katie Nolan talk about what sports might look like in 20 years
· In terms of current relevancy, one of the most interesting panels had to be “Making the Right Play: Optimizing the NBA’s Schedule Structure”. At the time, the COVID-19 global pandemic’s impact had not been fully realized yet. Games were still happening. March Madness, The Masters, Opening Day and the Olympics were still set to take place. Now every league’s schedule is in flux and creative solutions have become necessary. The discussions in this panel surrounding the possibility of pushing the NBA calendar back so, according to one suggestion by Atlanta Hawks CEO Steve Koonin, the first games happened on Christmas Day, were purely theoretical then. Now, not so much.

Some of the biggest names in basketball talk about what a reimagined NBA schedule could look like
· As a lifelong Spurs fan, I couldn’t help but approach R.C. Buford after the “3’s & Frees” panel he was on. Earlier that week, Tim Duncan made his coaching debut when Gregg Popovich took a night off for personal reasons. The Spurs did Duncan proud, rallying to beat the Hornets, although Buford said he anticipates Duncan’s coaching career being a short one.
· Tango also ran a session called “How to Create a Metric Using Statcast Data” where participants came in with their laptops and downloaded baserunning data and were taught how to work with and analyze it. The dataset showed how long it takes every baserunner, on average, to get from home plate to first base, in five-feet increments. This is potentially valuable information when trying to find out how the quickest accelerators are, as well as in determining the optimal defensive positioning setup so infielders are given enough time to throw baserunners out. When I attended SSAC in 2014, I was in the room when Statcast was first introduced to the general public by MLBAM president Bob Bowman. So it was personally gratifying to attend a Statcast-focused working session like this one.
· I had a couple of interesting conversations following another panel, “Basketball Analytics: Nothin’ But Net… Rating”, with a couple of the panelists. I asked former Bulls and Timberwolves head coach Tom Thibodeau what reporting he sought when he was coaching in the NBA. He told me he had a report every game that was about 40 pages long analyzing every possible aspect of his team and their opponent that day, as well as data on situations that might arise that day. Mike Zarren, who has worked in the Boston Celtics organization for the past 14 years, was another member of this panel and crossed paths with Thibodeau when he was an assistant with the Celtics under Doc Rivers from 2007-10. Zarren lamented the length of that report, saying he wondered how it would actually help him coach in a given game considering the copious amount of information it contained, although Thibodeau found it beneficial.
· In the presentation titled “Introducting a New Model of Pro Team Sports: Athletes Unlimited”, Jon Patricof introduced a new professional softball league he is the CEO and co-founder of. The focus of Athletes Unlimited is more on players than the teams they play for, which change every week during the six-week season. The scoring system rewards players for individual and team accomplishments, with the four highest-scoring players designated as team captains who draft teams for the following week’s games. When it rolls out in August, with all of the games happening in the Chicago area, it will definitely be worth a look.