Tableau Accelerator
Return Fraud Monitoring
According to the National Retail Federation, retailers lose $24 Billion* annually to return fraud. We've created an easy way to not only identify, but predict return activity in your establishments.
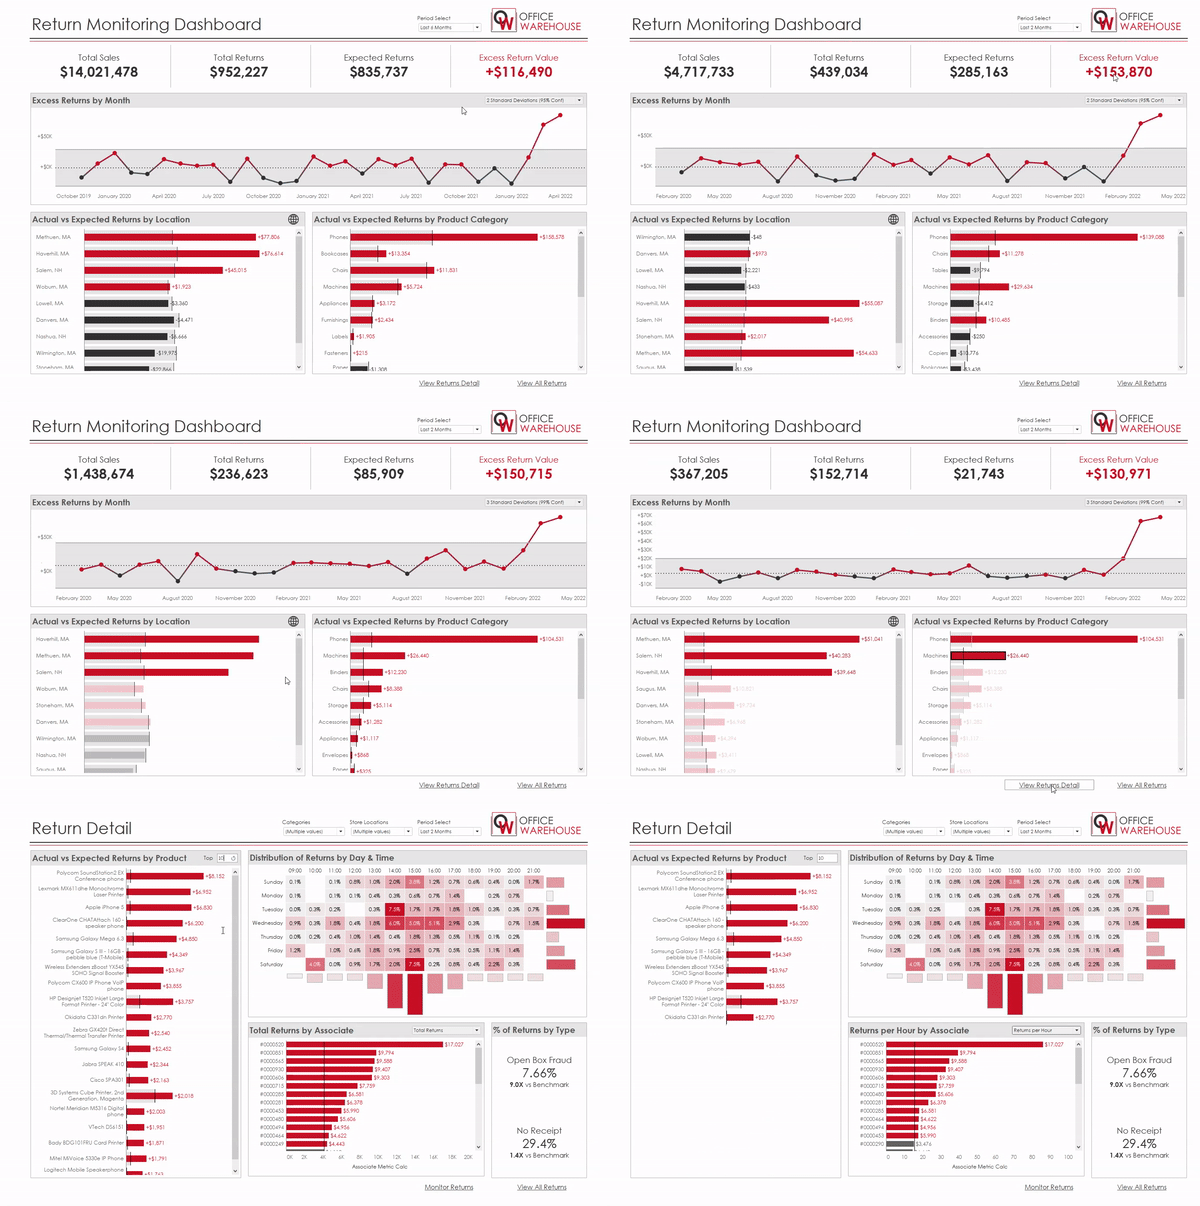
This Return Fraud Monitoring Dashboard leverages retail sales and returns data to monitor returns activity across all products and all store locations to identify potential fraud. The dashboard uses historical trends to predict return activity and clearly identifies areas that fall outside of those expected values.

Answer Key Business Questions
-
What were the actual returns in a given period and how does that compare to the expected returns?
-
Are there excess returns, which could signify fraud, occurring in any single store location or group of locations?
-
Are excess returns more prevalent in certain products or groups of products?
-
What days and times of the week are returns most common?
-
Which associates are processing the most returns?
-
How much of the returns are confirmed invalid (open box fraud), or potentially invalid (returned without receipt)?
Monitor and Improve KPIs
-
Total Sales
-
Total Returns
-
Expected Returns
-
Excess Returns
-
Excess Returns by Location
-
Excess Returns by Product Category
-
Excess Returns by Product
-
Distribution of Returns by Time & Day
-
Distribution of Returns by Associate
-
Percentage of Returns by Return Type
Returns can be complex if multiple systems are required to communicate in real time. Often, the retailer is relying on yesterday’s data to make today’s decision.
- Appriss Vice President of Marketing Tom Rittman
What are Tableau Accelerators?
Tableau Accelerators are ready-to-use dashboards and workbooks. They are meant to help you bring analytics to your line of business, vertical, or sector. Rather than starting with a blank canvas, you can now start with an expert-built (that's us!) dashboard to get data-driven insights faster. Start monitoring and improving KPIs across your entire business today!