The following blog by Brian Moore was originally published on Do Mo(o)re With Data June 13 , 2022 and is cross-posted here with permission. Brian is a Tableau Visionary, Tableau Public Ambassador, and a Senior Data Analytics and Viz Consultant for Cleartelligence.
Welcome to installment #3 of the “It Depends” blog series. If you’re not familiar with the series, each installment will cover a question where there is no clear definitive answer. We’ll talk through all of the different scenarios and approaches and give our recommendations on what approach to use and when. The question we are tackling this week is “How can dashboard actions be used to filter on multiple selections in a sheet?”. Pretty easy right. Just use a filter action…or a set action…or set controls…or a parameter action. There are clearly a lot of different ways to accomplish this, but which one should you use? And I think you know the answer…It depends!
But before we start…why does this even matter? Why not just throw a quick filter on the dashboard and call it a day? For me, it’s about user experience. When a user sees a mark on a dashboard and they want to dig into it, would they rather a) mouse over to a container filled with filters, find the right filter, click on a drop down, search for the value they want to filter, click that value, and then hit apply, or b) just click on the mark? Don’t get me wrong, quick filters are important, and often times essential, but they can also be a bit clunky, and can hinder performance. So whenever possible, I opt for dashboard actions.
Using dashboard actions to filter from a single mark is pretty easy, but the process gets a little more complicated when you want to be able to select multiple marks. And as developers, we have a choice on whether or not we want to push that burden onto our users. We have to decide what’s more important, ease of use for our users, or ease of setup for ourselves. We’ll also need to take performance into consideration. Those will be the two biggest decision points for which of these 4 methods to implement. And those methods are, as I mentioned above; Filter Actions, Set Actions, Set Controls, and Parameter Actions. There are no restrictions on these four approaches. Any one of them could be used in any scenario, but it’s up to you to weigh the importance of those two decision points and to determine which method gives you the right balance for your specific situation.
The Four Methods for Using Dashboard Actions
Filter Action
This is the easiest of the four methods to implement and provides users with a better user experience than quick filters, both in terms of interacting with the dashboard and performance. But there are some downsides. First off, in order to select multiple marks, users would either need to hold down the CTRL key while making their selections, or those marks would need to be adjacent so that users could click and drag to select multiple marks together. Not ideal. Also, with Filter Actions, the selections cannot be used in other elements of your dashboard (calculated fields, text boxes, etc), like they can with other methods. And finally, and this one might be a bit personal, you can’t leverage any of the highlighting tips that I discussed in Installment 1 of this series, Techniques for Disabling the Default Highlighting in Tableau. Technically, you could use the “Highlight Technique” but because you can’t use the selected values in a calculated field, there would be no clear way to identify which mark(s) have been selected. Full disclosure, I never use this technique, but I’m going to include it because technically it will accomplish what we’re trying to do.
Set Action
This method provides a somewhat similar user experience to Filter Actions. Better performance than quick filters, but users still need to hold CTRL, or click and drag to select multiple marks. The main benefit of this approach over Filter Actions is it’s flexibility. You can use it to filter some views, and in other views you can compare the selected values to the rest of the population. This type of analysis isn’t possible with Filter Actions. With Filter Actions, your only option is to filter out all of the data that is not selected. With Set Actions, you can segment your data into selected and not selected. You can also use those segments in calculated fields, which is another huge benefit over Filter Actions.
Set Controls
This method provides all of the same benefits of Set Actions, but with one major improvement. Users do not need to hold CTRL or click and drag. They can click on individual marks and add them one by one to their set. This method is a little more difficult to set up than the previous two, but in my opinion, it is 100% worth it. It’s possible that it may be marginally worse for performance, but I have never had performance issues using this method. The only things that I don’t like about this approach are that you can’t easily toggle marks in and out of the set (you can do this with a second set action in the ‘menu’, but it’s a bit clunky), and you can’t leverage the Filter Technique for disabling the default highlighting (we’ll talk more about this later).
Parameter Action
In my opinion this approach provides the best user experience. Users can select marks one by one to add to their “filter”, and can also, depending on how you set it up, toggle marks in and out of that filter. The main downside here is performance. This technique relies on some somewhat complicated string calculations that can really hurt performance when you’re dealing with large or complex data sets. It’s also the most difficult to implement. But when performance isn’t a concern, I love this approach.
Method Comparison
So which method should you use? Let’s take a look at those two decision points that I mentioned earlier, User Experience and Performance.

If neither of these decision points are important then you can ignore this entire post and just use a quick filter. But that’s usually not the case. If Performance is important, but you’re less concerned with User Experience, you can use either a Set Action or a Filter Action (but I would recommend Set Actions over Filter Actions). If User Experience is important and Performance is not a concern, you can use a Parameter Action. And if both User Experience and Performance are important, then Set Controls are the way to go. But as I mentioned earlier, you are not limited to any of these methods in any scenario, and there could be other elements that influence your decision. So let’s do a closer comparison of these methods.

*Flexibility refers to how the selected values can be used in other elements of the dashboard
**Default Highlight Techniques refer to which technique (from Installment 1) can be used with each method
So now we have a pretty good idea which method we should use in any given scenario. Now let’s look at how to implement each of these.
Methods in Practice
For each of these methods we are going to use this ridiculously simple Sales dashboard. We’re going to use the bar chart on the left (Sales by Subcat) to filter the line chart on the right (Sales by Quarter). If you’d like to follow along, you can download the sample workbook here.

Filter Action
As I mentioned earlier, this is the easiest method to set up, but will require your users to either hold CTRL or click and drag to select multiple marks.
Go to Dashboard > Actions and click “Add Action”
Select “Filter” from the list of options
Give your Action a descriptive Name (ex. SubCat Filter)
Under “Source Sheets” select the worksheet that will drive the action. In this example it is our bar chart “Sales by SubCat”.
Under “Target Sheets” select the worksheet that will be affected by the action. In this example it is our line chart “Sales by Quarter”
Under “Run action on” choose “Select”
Under “Clearing the selection will” choose “Show All Values”
Click “OK”
When you’re finished, your “Add Filter Action” box should look like this
And now when we click on a mark, hold CTRL and click multiple marks, or click and drag to select multiple marks our line chart will be filtered to just the selected value(s). And when we click in the white space on that sheet, or the selected value (when only one mark is selected) the filter will clear and the line chart will revert to show all values
Set Action
Filtering with Set Actions is slightly more involved but still pretty straightforward. For this method we need to create our set, we need to add that set to the Filter Shelf on our line chart, and then we need to add the dashboard action to update that set.
Go to the sheet that will be affected by the action. In this case it is our line chart (Sales by Quarter).
Create a set for the field that will be used for the filter. In this case it is our [Sub-Category] field.
Right click on [Sub-Category]
Click on “Create”
Click on “Set”
Click the “All” option to select all values
Click “OK”
Add the filter to the sheet that will be affected by the action (Sales by Quarter).
Drag the [Sub-Category Set] to the filter shelf on the “Sales by Quarter” worksheet
It should default to “Show Members in Set”, but just in case, click on the drop-down on the [Sub-Category Set] pill on the filter shelf and make sure that is the option selected
Add the dashboard action to update the [Sub-Category Set]
Navigate back to the dashboard
Go to Dashboard > Actions and click “Add Action”
Select “Change Set Values” from the list of options
Give your Action a descriptive Name (ex. SubCat Set Action Filter)
Under “Source Sheets” select the worksheet that will drive the action. In this example it is our bar chart “Sales by SubCat”.
Under “Target Set” select the set that was used as the filter in the previous steps. In this case it is our [Sub-Category Set]
Under “Run action on” choose “Select”
Under “Running the action will” choose “Assign values to set”
Under “Clearing the selection will” choose “Add all values to set”
Click “OK”
When you’re finished your “Add Set Action” box should look like this.

The way this Set Action configuration works is that each time you make a new selection, the contents of the set are being completely overwritten with the newly selected values. That’s what the “Assign values to set” option does. And when you clear the selection, by clicking on white space in the sheet, or the last selected value, the contents of the set are replaced again with all of the values. That’s what the “Add all values to set” option does.
I would recommend one additional step if you’re using this method to override the default highlighting. When using Set Actions you are somewhat limited on what techniques you can use for this, but the “Highlight Technique” works great. You can read about how to use that technique here. Once you’ve added the Highlight Action, just put the [Sub-Category Set] field on color on your “Sales by Subcat” sheet and select the colors you want to display for marks that are selected (in the set) and marks that are not selected (out of the set). When you’re done, your dashboard should look and function like this. Keep in mind that similar to Filter Actions, users will need to hold CTRL and click, or click and drag to select multiple marks.
Set Controls
Setting up our filter with Set Controls is going to be very similar to Set Actions, but with one major difference. The way Set Controls work is that they allow you to select marks one by one and either add them to your set or remove them from your set. This is a great feature, but it makes filtering with them a little tricky.
If we were to start with all of our values in the set, we couldn’t just click on a value in our bar chart to add it to the set, since it’s already there (as well as all of the other values). So we need to start with the set empty and then start adding values when we click on them. But if our set is empty, and we use that set as a filter, as we did in the previous example, then our line chart will be blank until we start adding values. And we don’t want that. We want the line chart to show all of the values, until we start selecting values, and then we want it to just show those values. And we can accomplish this with a calculated field. So first, we’re going to create our set, then we’ll create our calculated field, then we’ll add that field as a filter to our line chart, and then we’ll add the action to update the set.
Go to the sheet that will be affected by the action. In this case it is our line chart (Sales by Quarter).
Create a set for the field that will be used for the filter . In this case it is our [Sub-Category] field. (skip this step if you followed along with the Set Action example)
Right click on [Sub-Category]
Click on “Create”
Click on “Set”
Click the “All” option to select all values
Click “OK”
Create a calculated field called [SubCat Filter]
{ FIXED : COUNTD([Sub-Category Set])}=1 OR [Sub-Category Set]
Add the filter to the sheet that will be affected by the action (Sales by Quarter).
Drag the [SubCat Filter] field to the filter shelf on the “Sales by Quarter” worksheet
Filter on “True”
Add the dashboard action to update the [Sub-Category Set]
Navigate back to the dashboard
Go to Dashboard > Actions and click “Add Action”
Select “Change Set Values” from the list of options
Give your Action a descriptive Name (ex. SubCat Set Control Filter)
Under “Source Sheets” select the worksheet that will drive the action. In this example it is our bar chart “Sales by SubCat”.
Under “Target Set” select the set that was used as the filter in the previous steps. In this case it is our [Sub-Category Set]
Under “Run action on” choose “Select”
Under “Running the action will” choose “Add values to set”
Under “Clearing the selection will” choose “Remove all values from set”
Click “OK”
When you’re finished your “Add Set Action” box should look like this.

So there are a couple of things we should cover here, starting with the calculated field. Here it is again.
{ FIXED : COUNTD([Sub-Category Set])}=1 OR [Sub-Category Set]
Sets only have two possible values; IN or OUT. The set may contain hundreds or even thousands of values from the source field, but the sets themselves can only have these two values. So if we use a FIXED Level of Detail expression and count the distinct values, the result will be either 1 or 2. If the set is empty, the value for every record will be OUT, so the result of the LOD will be 1. Similarly, if the set contains all values, the value for every record will be IN, so the result of the LOD will still be 1. But if some values are in the set (IN) and other values are not in the set (OUT), then the result of the LOD will be 2 (IN and OUT).
So the first part of this calculated field ( FIXED : COUNTD([Sub-Category Set])}=1) will be true for all records when the set is empty, or if it contains all values. The second part of this calculated field (OR [Sub-Category Set]) will only be true for records in the set. So when we start with an empty set, the overall result of this calculated field will be True for every record, so everything will be included in our line chart. As soon as we add a value to our set, the first part becomes false for every record, but the second part becomes true for the values in our set. Because we are using an OR operator, the overall result, once we click on some values, will be true for the selected values and false for the rest of the values.
Next, let’s look at the Set Control options. We are starting with an empty set. Each time we click on a new mark, that value will be added to our set. That’s what the “Add values to set” option does. Unlike the “Assign values to set”, it does not override the set, it just adds new values to the existing ones. And then when we click on some white space in the sheet, or the last selected value, the set will go back to being empty. That’s what the “Remove all values from set” option does.
And just like in the previous example, I would recommend using the “Highlight Technique” covered here, and then adding the [SubCat Filter] field to color on the bar chart (Sales by SubCat).
And now your dashboard should look and function like this. Notice that you no longer need to CTRL click, or click and drag, to select multiple values. Nice!

Parameter Action
This method is by far the most complex, but if done correctly, it provides a really smooth user experience. The thing that I like most about this approach is that you can set it up so that you can “toggle” values in and out of the filter. There are a few extra steps in this approach, and some somewhat complex calculations. We need to create our parameter, create a calculated field that will be passed to that parameter, add that field to Detail on our bar chart, create a calculated field for our filter, add that filter to our line chart, and add the dashboard action that will update the parameter.
Create a string parameter called [SubCat Select] and set the “Current value” to the pipe character “|”
Create a calculated field called [SubCat String]
IF CONTAINS([SubCat Select], ‘|’ + [Sub-Category] + ‘|’) THEN REPLACE([SubCat Select],’|’ + [Sub-Category] + ‘|’,’|’)
ELSE [SubCat Select] + [Sub-Category] + ‘|’
END
Go to the sheet that will drive the parameter action and drag the [SubCat String] field to Detail. In this example, that is the “Sales by SubCat” sheet
Create a calculated field called [SubCat String Filter]
[SubCat Select]=’|’ OR CONTAINS([SubCat Select],’|’+[Sub-Category]+’|’)
Add the filter to the sheet that will be affected by the action (Sales by Quarter).
Drag the [SubCat String Filter] field to the filter shelf on the “Sales by Quarter” worksheet
Filter on “True”
Add the dashboard action to update the [Sub-Category Set]
Navigate back to the dashboard
Go to Dashboard > Actions and click “Add Action”
Select “Change Parameter” from the list of options
Give your Action a descriptive Name (ex. SubCat Parameter Filter)
Under “Source Sheets” select the worksheet that will drive the action. In this example it is our bar chart “Sales by SubCat”.
Under “Target Parameter” select the parameter that was set up in the previous steps. In this example it is [SubCat Select]
Under “Source Field” select the [SubCat String] Field
Under “Aggregation”, leave set to “None”
Under “Run action on” choose “Select”
Under “Clearing the selection will” choose “Keep Current Value”
Click “OK”
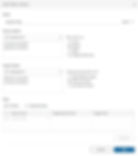
When you’re finished, your “Add Parameter Action” box should look like this

Alright, let’s talk through some of those calculations, starting with the [SubCat String] Field. Basically, what this calculation is doing is building and modifying a concatenated string of values. Here’s that calculation again.
IF CONTAINS([SubCat Select],’|’ + [Sub-Category] + ‘|’) THEN REPLACE([SubCat Select],’|’ + [Sub-Category] + ‘|’,’|’) ELSE [SubCat Select] + [Sub-Category] + ‘|’ END
We set up our parameter to have a default value of just the pipe character (“|”). I’ll explain the use of the pipes a little later on. The first line of the calculation looks to see if the selected value is already contained in our string. So it’s searching our entire concatenated string for the pipe + selected value + pipe (ex. |phones|). If it finds that value in our string, it will replace it with just a pipe. So for our example, if our parameter value was |phones|binders|storage| and we click on phones, it will replace “|phones|” with a pipe, leaving “|binders|storage|”
The second line of this calculation will add the selected value. The calc has already tested to see if it’s there in the previous step, and if it’s not, this line will add it along with a pipe. Now let’s look at our parameter action…in action.
Take a look at the parameter at the top. As we click on each Sub-Category, its added to our string. Now look what happens when we click on those selected marks again.

As we click on each previously selected mark, that mark is removed from our string, until we’re left with just our starting value, the pipe.
The reason I use pipes on both sides, instead of just a comma separated list is to avoid situations where one potential value could be equal to a part of another value (ex. Springfield and West Springfield). The pipes ensure we are matching exact values in the next step, our filter calculation. Here’s that filter calculation again.
[SubCat Select]=’|’ OR CONTAINS([SubCat Select],’|’+[Sub-Category]+’|’)
This is pretty similar to the filter that we created in our Set Controls example. The first part is checking to see if our concatenated string is “empty”, meaning nothing has been selected yet and it’s just a pipe. If that’s the case, the result of this calculated field will be true for every record. The second part of the calculated field is checking the [Sub-Category] field in each record and seeing if that value is contained within our parameter string (along with the starting and ending pipe). If it is, the result of this calculation will be True for those records and False for all of the other records.
When using this method, I would highly, highly, highly recommend using the “Filter Action” technique for disabling the default highlighting. You can find it here. This technique not only masks the selection, but it also automatically de-selects a mark after you click on it. That is really important when using this method. Once you add that Filter Action, just add the [SubCat String Filter] field to color, and you should be good to go. Here’s what it looks like in action.
And there you have it. Four different methods for filtering your dashboards on multiple selections. As I mentioned before, some of these are much more complex than others, but they provide a much better user experience. In my opinion, it’s worth it to put in the extra time and effort to save your users frustration later on. I hope you enjoyed this post, and keep an eye out for more installments of “It Depends”.